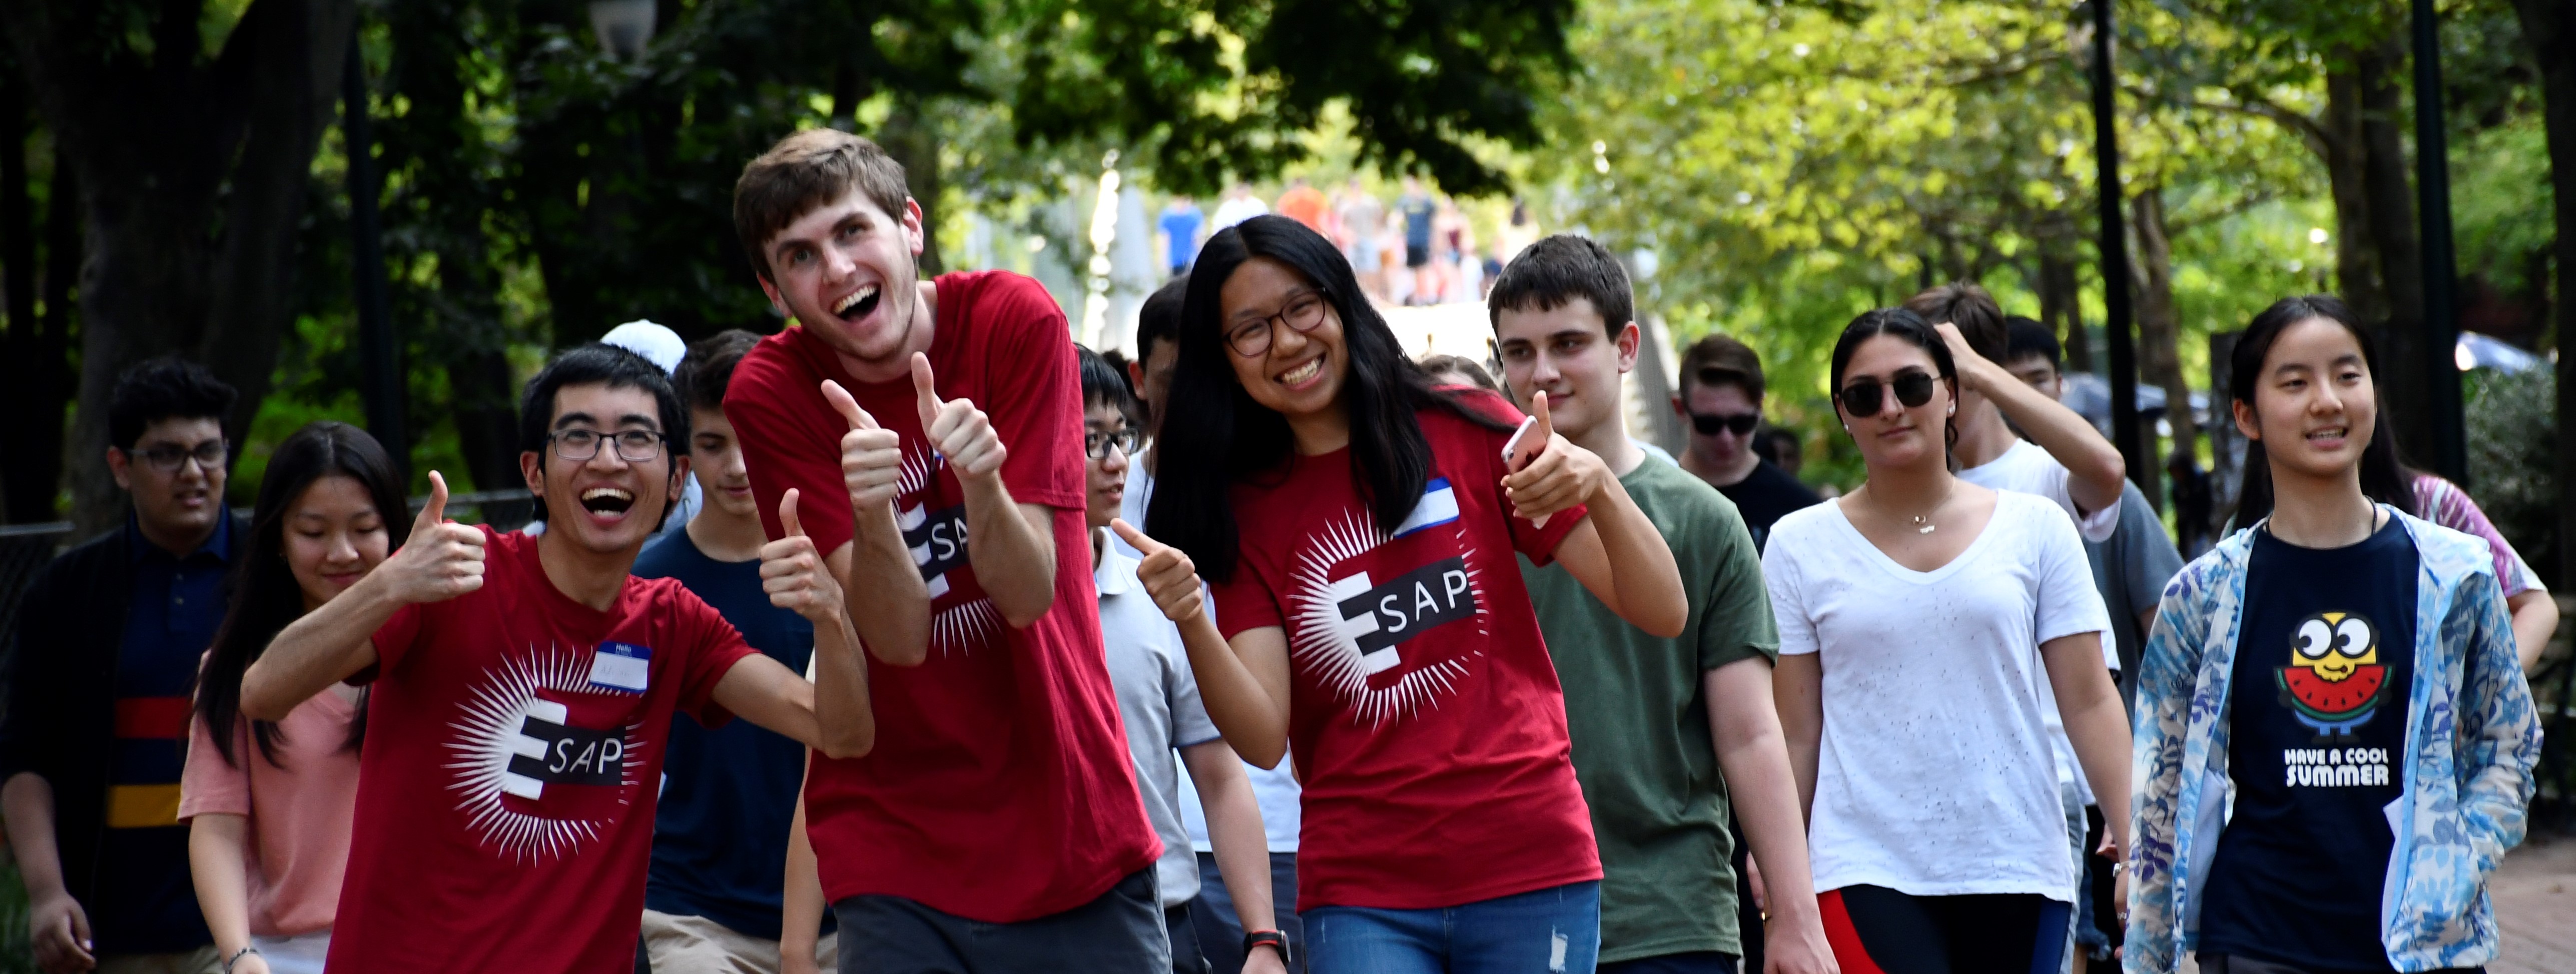
Engineering Summer Academy at Penn
I spent July 2019 as a residential TA for the Engineering Summer Academy at Penn’s Complex Networks course. The professor for the program (Victor Preciado) decided to switch the programming curriculum from MATLAB to Python, and let the RTAs figure out the programming lesson plans and homeworks.
I helped design the Python curriculum, and did the programming legwork - generating randomized inputs, setting up grading protocols, creating interesting sample graphs, and writing sample solutions.
The students’ main programming challenge was the implementation of two graph contagion models in Python. The first model was decision-based, where a node would be infected if its proportion of infected neighbors exceeded a predetermined threshold. Because of the deterministic nature of this model, implementation was fairly simple and outputs were consistent. The second model was a little more tricky.
Independent cascade model (ICM)
In this model, a node infects its neighbor with a probability corresponding to that outgoing edge’s weight (between 0 and 1). Because of this randomness, the spread of the infection could vary quite significantly, so we told the students to build in a parameter for the number of simulations.
Increasing the number of repeated infections with the same starting nodes (seeds) would give a more accurate average infection size. Because the students’ final project revolved around choosing highly infectious seeds, it was important to implement an efficient model to test their seeding algorithms quickly and accurately.
Switching Data Structures
I initially maintained an adjacency list to track all information for the graph, but further optimizations required storing an adjacency matrix and a dictionary of degrees as well. The matrix allowed edge probabilities to be queried in constant-time, the list avoided iteration over non-neighbor nodes, and the dictionary found the number of non-infected neighbors in constant time.
Another optimization involved switching from sets to a queue for an iteration of infection. While running the simulation, I was originally using sets - adding infected nodes, merging with the set of already-infected nodes to eliminate duplicates, then re-iterating. Switching to a queue eliminated this redundancy.
Eliminating Expensive Operations
The most significant runtime improvement came from eliminating any method that created a deep copy of a data structure. Because of the need to start each iteration with the same starting infected nodes, my first attempts made a deep copy of the starting adjacency matrix, list, and degree dictionary for each iteration. These were then modified during the infection simulation, which made individual simulations very fast, but at the cost of an expensive deep copy.
Instead of copying the entire graph structure, I opted to make a deep copy of the 20 seeds for each iteration. The deep copy would be used to hold all infected nodes over the course of a single iteration, resulting in the same functionality without any need to modify or duplicate the graph.
Chung-Lu graph generation
The other notable script I wrote involved generating graphs for the students’ final projects, where they would try to select the twenty most infectious seeds in a directed graph. Seed choice had to matter, but the professor didn’t want simple algorithms like out-degree performing as well as more complex measures of centrality.
Requirements
Dr. Preciado outlined a plan for a modified Chung-Lu graph, with the following characteristics:
- The 1000-node graph consisted of five isolated communities of equal size. This limited the effectiveness of less sophisticated algorithms if they did not account for distance between seeds.
- Nodes have different expected degrees.
A naive random graph, where an edge is created between two vertices with some constant probability, would not pass the second requirement since the expected degree for every vertex is the same. Dr. Preciado wanted a linear distribution instead, where each community of 200 nodes would have expected degree from 100 down to 1.
Generator implementation
The Chung-Lu model took one of the five 200-node communities and gave each node a w-value ranging from 100 to 1, corresponding to the node’s expected final degree before dampening.
The probability of an edge forming from node i to node j was equal to \( \frac{w_i * w_j}{\rho} * 0.7 \) where \( \rho \) was the sum of w-values in the community and 0.7 was a constant dampening factor to reduce the edge density of the graph. Essentially, pairs of vertices with a larger product of w-values had a greater chance of forming an edge between them.
The script used a single 1000 by 1000 matrix to store the dampened w-value products., and random generation to generate the actual graph. The end result was an adjacency matrix that could easily be formatted as an edge list for the students’ input.
To hide the communities of the graph from students, the script scrambled the adjacency matrix after constructing it. If this hadn’t been done, the adjacency matrix would have been five diagonally stacked blocks of probabilities, with zeroes everywhere else. I used a dictionary as a basic substitution list to reassign node numbers.